- Java: Nothing Without The Community - Can Java flourish without deep community stewardship? See this too.
- Big Brotheresque App Kills Your Automotive Anonymity - Interesting use of data, but not sure I like the loss of privacy.
Showing posts with label data. Show all posts
Showing posts with label data. Show all posts
Tuesday, December 21, 2010
links for 2010-12-21: Thoughts on Java stewardship; Losing your automotive anonymity

Tuesday, December 14, 2010
links for 2010-12-14: IBM's Watson to play Jeopardy; FreeBSD on EC2; Data on Hudson/Kohsuke; Open data
- IBM’s “Watson” Computing System to Challenge All Time Greatest Jeopardy! Champions - This should be entertaining and interesting to watch.
- FreeBSD on Amazon EC2 - I'm somewhat surprised it has taken this long!
- Hudson's Secret: Kohsuke - Eduardo offers some insight into a fantastic developer. But also shows a great example of visualizing data. Love it!
- Make Data Dance - Another great article on generating value and intelligence from data. And kudos to the Bill Gates Foundation for requiring that data from projects they fund be open.
Wednesday, October 27, 2010
links for 2010-10-27: Netflix moves to AWS; RedMonk Analytics; Google Docs Charting; Apple alienating their users
- Netflix transitions to HA storage in the Cloud - The value of moving to the Cloud isn't just for startups. Netflix has their own data center, but elected to transition to the Cloud to not burden their IT staff with mundane data center build out.
- RedMonk Analytics: What Operating Systems are Developers Using? - It depends on the perspective and which developer audience is looked at!
- Using new visualizations to tell your story - Improving the charting Google Docs can deliver.
- Apple Won't Push Flash Player Updates - Apple's alienation of developers and consumers continues.
Wednesday, October 20, 2010
links for 2010-10-20: SkySQL forking?; IBM, Oracle, and Java; Linux catching Microsoft; Developer Intelligence; Twitter predicts stocks; McNealy at PG West
- SkySQL will try to drive MySQL fork, Oracle's ouster - Not a fork yet, but supporting one (MariaDB) and not ruling out creating one.
- IBM, Oracle and Java: The Q&A - @sogrady's always well written Q&A with a kind mention of the questions I sent him.
- Linux Starts to Eat Microsoft’s Lunch in Servers - Shows Linux growth (79% adding more Linux vs 21% adding more Windows), but it is a lot easier to show growth when coming from behind.
- Introducing Project Arcturus, Part 1: The World’s First and Only Developer Intelligence Tool - A great use of data to provide insight into developers. Kudos to RedMonk for building it. ReadWriteWeb has a review here.
- Twitter mood predictions the stock market - Another fascinating use of data.
- Scott McNealy Keynote Speaker at PG West - A great opportunity to hear Scott speak.
Thursday, October 7, 2010
links for 2010-10-7: IE market share dips below 50%; Analysis of Google's response to Oracle; SQL and Big Data
- EU dings Microsoft's IE browser market share, says Statcounter - The move towards other browsers continues.
- Google responds to Oracle's Android patent lawsuit, we break it down - Google accuses Oracle of flip-flopping, and implies if they've violated anything than Apache Harmony has too.
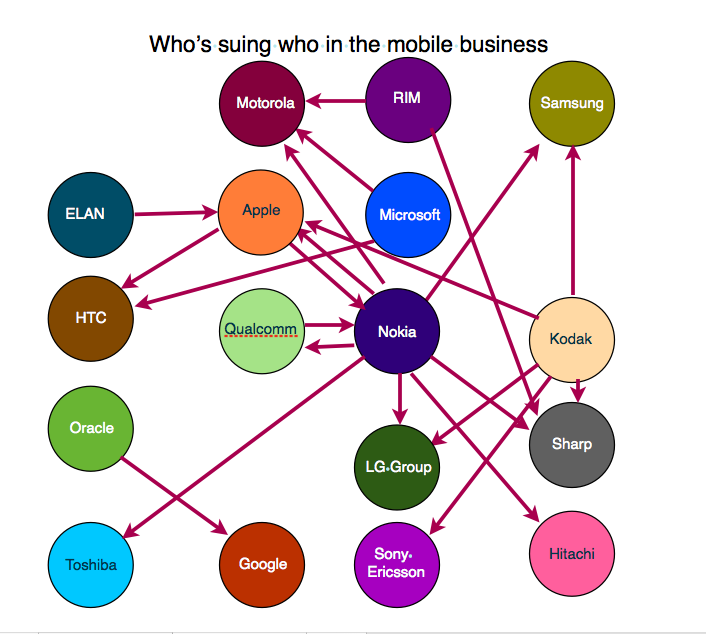
- Who's suing who in the mobile business - Wow, I didn't know Nokia was at the center of so many of the suits.
- Who's suing who in the telecoms trade - Similar to the above, but with a bullet on each suit.
- Why relational databases make sense for big data - Good car, Indy car, helicopter analogy from Ed.
Friday, August 20, 2010
links for 2010-08-20: Ellison to hire Hurd?; Laptop reliability survey; Google thwarted by California; Oracle vs Google on Java; Cloud data offers intelligence; Ubuntu advantages over Windows and OS X
- Mark Hurd to Oracle? Don't be surprised - An interesting idea.
- Acer makes the shoddiest laptops, say IT professionals - From those they surveyed, I'd agree Acer is at the bottom of the list. It is interesting to see HP and Dell with high percentages in both the best and worse categories.
- Google accuses California of rigging bidding process for e-mail contract - I personally find Google's labels and search preferable to traditional e-mail clients. Let's hope California didn't have a closed mind on the subject.
- Charles Nutter's thoughts on Oracle vs Google - A great read if you have the time. If you don't, Stephen O'Grady's thoughts are good as well (and shorter).
- Intuit: Small businesses slow hiring; increase pay and hours worked - Another great example of how Cloud based services (Intuit's Online Payroll service) offer an opportunity to use volumes of data to offer intelligence.
- Ubuntu's two big advantages over Windows and Mac - Jason makes very good points. I doubt it is going to cause a major shift to Ubuntu though...
Sunday, July 25, 2010
Visualizing your data with Tableau Public
As I've written before, I have a passion for data and oftentimes, particularly with large amounts of data, visualizing it is an extremely important part of understanding it.
As part of my computer ratings, I've created performance charts for awhile now and they are very useful in being able to see how a team has performed and any trends there may be. You can see examples from my 2010 Superbowl Preview or BCS Championship Preview.
I've created these using Google Charts using a series of scripts to extract the data from my ratings system and format it into the appropriate URLs, but after learning about Tableau Public I've been wanting to give it a shot to see if it was easier or offered other benefits and with summer arriving finally had a chance to.
I created the charts for a few teams from last years college football season and the process was very straight-forward. All I had to do was to create a CSV file of my data, import it into Tableau Public Desktop, then with a little drag and drop and configuration, create the charts. It is then simple to publish to the web. Here it is (click the image to get a full screen version):

This was definitely a lot easier than what I've been doing before. As the 2010 football seasons start, I'll be trying it out more and seeing what else I can do with it and hopefully automate the generation of the charts as much as I have with Google. Give it a try yourself!
As part of my computer ratings, I've created performance charts for awhile now and they are very useful in being able to see how a team has performed and any trends there may be. You can see examples from my 2010 Superbowl Preview or BCS Championship Preview.
I've created these using Google Charts using a series of scripts to extract the data from my ratings system and format it into the appropriate URLs, but after learning about Tableau Public I've been wanting to give it a shot to see if it was easier or offered other benefits and with summer arriving finally had a chance to.
I created the charts for a few teams from last years college football season and the process was very straight-forward. All I had to do was to create a CSV file of my data, import it into Tableau Public Desktop, then with a little drag and drop and configuration, create the charts. It is then simple to publish to the web. Here it is (click the image to get a full screen version):
This was definitely a lot easier than what I've been doing before. As the 2010 football seasons start, I'll be trying it out more and seeing what else I can do with it and hopefully automate the generation of the charts as much as I have with Google. Give it a try yourself!
Tuesday, May 4, 2010
links for 2010-05-04: IBM acquires Cast Iron Systems; Scaling open-source; Browser market share; Software patents are good ... for lawyers; Google's cash; Open Data; Android on your TV
- IBM acquires Cast Iron Systems - IBM making more of a push into the Cloud. Another set of thoughts.
- Open-source support: Can it scale? - "Enterprises turned to open source to shave money in the economic downturn and are staying with it now to drive greater innovation and productivity."
- Browser market share: IE drops below 60% - Every browser other than IE shows a growth trend (Opera interestingly seems to have plateaued though), particularly Chrome.
- Browsers: Does minimalist win the race? - ZDNet speculates on why IE is losing share and Chrome is gaining. A few quotes: "Tech geeks aside, people are more interested in web content than they are the browser" and "... Chrome just kind of blends into the background".
- Patent Litigation Weekly: MobileMedia's Unusual Patent Infringement Campaign - Give it away free or let folks use it for free to get adoption, then swoop in and sue. Nice.
- Google at a loss for what to do with cash? - They'd have to do a lot of acquisitions to spend $26.5B!
- The Future of Open Data - Some interesting ideas. I have to admit that I've run across data sets where I have made changes or cleanup and what Stephen describes would work better than just sharing the Google Spreadsheet I've done in the past.
- Ready for Android on your ... TV? - Not really a surprise as TV's are a natural for being connected and a platform for new types of apps.
Wednesday, April 21, 2010
links for 2010-04-21: VMware's "database" play; AT&T buoyed by iPhone; 2010 NFL projected records; Adobe giving up on iPhone
- VMware’s SpringSource Redis and Rabbit acquisitions: A Database Play is Emerging - Just don't call it "database" apparently. But as Paul Martiz said, "... we are adding to the repertoire of underlying middleware and technologies that we think are going to be needed to generate – to develop a new generation of applications." appears to be a strong plan.
- AT&T earnings propelled by iPhone activations, connected devices like e-readers, GPS systems - If this causes them to continue to invest more in their network, all good.
- 2010 NFL projected records - With the draft tomorrow, will your favorite team improve? These projected records serve as a good baseline of what to expect next year and an interesting use of data from last years performance.
- Adobe casts Flash lot with Android; Drops iPhone plans - Will this bite Apple in the future? "The primary goal of Flash has always been to enable cross browser, platform and device development. The cool web game that you build can easily be targeted and deployed to multiple platforms and devices. However, this is the exact opposite of what Apple wants. They want to tie developers down to their platform, and restrict their options to make it difficult for developers to target other platforms." Note that I've increasingly seen Flash crashing or hogging CPU on a Mac, but that too could be part of the Apple/Adobe battle.
Wednesday, April 14, 2010
links for 2010-04-14: Twitter ads; VMware/SS acquires RabbitMQ; Apps=Fish, Data=Wine
- Quicktake Analysis: What Twitter’s “Promoted Tweets” Means To The Ecosystem - It will be interesting to see this play out.
- Twitter predicts the future? - Great example of how the influx of data we have today can be used.
- SpringSource Acquires RabbitMQ Cloud Messaging Technology - A continuation of their move into the Cloud.
- Oracle drops top architect into MySQL skeptic zone - "If Oracle corporate hoped Screven's message would draw applause based on some collective relief it was wrong: just one person in the hushed room clapped - furiously - and this was possibly one of Oracle's employees spotted at the show trying to cheerlead a round of unspontaneous applause."
- Infosys lands deal to manage Microsoft's internal IT services - A great win for Infosys.
- Why applications are like fish and data is like wine - "But if we look at business architectures data has the longest shelf life, followed by business logic, followed by presentation."
- Bravo Apple - "Finally, Apple is doing away with those arrogant upstarts who think then can write a few lines in a high level language and call it a program."
Monday, April 12, 2010
links for 2010-04-12: What Microsoft and Apple can learn from Ubuntu; Who will buy Palm?; Greenplum moves data to Cloud; Calculus explained
- One big thing Microsoft, Apple, and all CTOs can learn from Ubuntu - "What Canonical does really well is to methodically produce incremental upgrades to its OS. It is transparent about its goals and plans, and it releases its software on schedule. In fact, this incremental approach is Ubuntu’s most potent competitive weapon against rivals Microsoft Windows and Mac OS X."
- Who may buy Palm? - Interesting question.
- Greenplum pushes enterprise data cloud with new releases - Interesting that McNeally is an advisor to Greemplum and they have their sights set on Oracle.
- Change We Can Believe In - The next in an excellent series of blog entries explaining math.
Saturday, April 10, 2010
Are the Red Sox and Yankees Slow? Let's look at the data
There has been a bit of hubbub about the pace of play in Yankees and Red Sox games after umpire Joe West call their slow play embarrassing. Their first 3 games of the year were longish at 3:46, 3:48, and 3:21 but justifications for it include lots of hitting to the importance of the games to being national TV games with longer commercial breaks.
Rather than just throw various arguments around, lets go to the data to take a look at what it tells us. The length of a game should be roughly determined by the number of innings, number of pitches, number of in inning pitching changes, and duration of the commercial breaks. With that in mind, I looked at the three Yankess vs Red Sox games and then all the American League games played on 4/9 to compare them.
All the data is in a Google Docs spreadsheet, and includes the game time, innings, pitches, in inning pitching changes, and commercial length based on if it is a national TV game or not. Using these stats I calculate the average time per pitch, which all things being equal should be pretty consistent from game to game.
Now, admittedly it is a small sample size, but it seems pretty clear that there is something common about the 5 slowest games from the selected games. Given that I've factored in a bunch of stuff, why is this? It is likely caused by visits to the mound by the manager (which are limited) or fellow players (which aren't) and batters stepping out between pitches, and that is what Joe West was complaining about.
Is it the end of the world if some games are a few seconds per pitch slower than others? In the grand scheme of things, probably not, but MLB has decided to try to speed things up and from the data above, it appears Joe West singling out the Yankees and Red Sox as the biggest offenders could very well be true.
Rather than just throw various arguments around, lets go to the data to take a look at what it tells us. The length of a game should be roughly determined by the number of innings, number of pitches, number of in inning pitching changes, and duration of the commercial breaks. With that in mind, I looked at the three Yankess vs Red Sox games and then all the American League games played on 4/9 to compare them.
All the data is in a Google Docs spreadsheet, and includes the game time, innings, pitches, in inning pitching changes, and commercial length based on if it is a national TV game or not. Using these stats I calculate the average time per pitch, which all things being equal should be pretty consistent from game to game.
| Date | Game | Time per Pitch |
|---|---|---|
| 4/6 | Yankees / Red Sox | 0:35 |
| 4/9 | Yankees / Rays | 0:33 |
| 4/4 | Yankees / Red Sox | 0:32 |
| 4/9 | Red Sox / Royals | 0:31 |
| 4/7 | Yankees / Red Sox | 0:31 |
| 4/9 | Blue Jays / Orioles | 0:30 |
| 4/9 | Twins / White Sox | 0:28 |
| 4/9 | Athletics / Angels | 0:28 |
| 4/9 | Indians / Tigers | 0:27 |
| 4/9 | Mariners / Rangers | 0:26 |
Now, admittedly it is a small sample size, but it seems pretty clear that there is something common about the 5 slowest games from the selected games. Given that I've factored in a bunch of stuff, why is this? It is likely caused by visits to the mound by the manager (which are limited) or fellow players (which aren't) and batters stepping out between pitches, and that is what Joe West was complaining about.
Is it the end of the world if some games are a few seconds per pitch slower than others? In the grand scheme of things, probably not, but MLB has decided to try to speed things up and from the data above, it appears Joe West singling out the Yankees and Red Sox as the biggest offenders could very well be true.
Friday, April 9, 2010
Further Analysis of Java Platform Survey Results
I wrote about some initial observations and issues with a recent Java platform survey earlier today, but couldn't help myself and downloaded the raw data and did some further analysis myself and came across some additional interesting observations.
First, I dug into the Java EE app server data and like Rich fixed some of the grouping, specifically trying to get proper JBoss and Tomcat numbers. Our numbers differ a bit as I think he may be double counting a bit for Tomcat and JBoss which I made sure not to do.

I've ignored Jonas/JRun/Jetty/Orion so the other likely represents GlassFish and Geronimo. My chart shows JBoss behind WebSphere but ahead of WebLogic.
Since multiple answers were allowed though, it is interesting to see which combinations are most common.

Here, Tomcat is clearly the preferred second app server in a dual strategy, but perhaps surprisingly, there is a fair number that have both WebSphere and WebLogic.
Last, I took a closer look at the operating system data. I first combined the different Linux responses into a single one.

As I mentioned in my earlier entry, Linux usage is nearly surpassing Windows and Solaris is well behind those two.
Next I looked at what operating systems were commonly included in the same response.

Not surprisingly Windows and Linux are the most common combination and the combinations with Solaris fall behind with Linux and Solaris slightly behind.
These results may match what you'd intuitively expect, but it is always good when the data backs up your intuition.
First, I dug into the Java EE app server data and like Rich fixed some of the grouping, specifically trying to get proper JBoss and Tomcat numbers. Our numbers differ a bit as I think he may be double counting a bit for Tomcat and JBoss which I made sure not to do.
I've ignored Jonas/JRun/Jetty/Orion so the other likely represents GlassFish and Geronimo. My chart shows JBoss behind WebSphere but ahead of WebLogic.
Since multiple answers were allowed though, it is interesting to see which combinations are most common.
Here, Tomcat is clearly the preferred second app server in a dual strategy, but perhaps surprisingly, there is a fair number that have both WebSphere and WebLogic.
Last, I took a closer look at the operating system data. I first combined the different Linux responses into a single one.
As I mentioned in my earlier entry, Linux usage is nearly surpassing Windows and Solaris is well behind those two.
Next I looked at what operating systems were commonly included in the same response.
Not surprisingly Windows and Linux are the most common combination and the combinations with Solaris fall behind with Linux and Solaris slightly behind.
These results may match what you'd intuitively expect, but it is always good when the data backs up your intuition.
Java Platform Survey Results - Flaws and Observations
I love surveys and analyzing the resulting data from them, so was interested to take a look at Replay Solutions write up from their 2010 Java Platform Survey. Unfortunately, as is the case with many survey's, the way the data is presented has some issues that could result in folks making the wrong conclusions.
Rich correctly pokes holes in the report pointing out the strange grouping of results, the significant "other", and the egregious omission of GlassFish from the survey (quite possibly the bulk of the 18% "other"). If GlassFish was even only half of the "other" it would be 9% and equal to Jetty and way ahead of Jonas/JRun/Orion (which were grouped together for some reason) and Resin, each at only 2%, which would seem to clearly justify GlassFish being called out on its own. They do provide the raw data which is fantastic, but re-analyzing the data can't fix not asking the right questions.
But there were a few other items in the report that I found interesting.
The "most important Java IDE in 2010" is, no surprise, Eclipse, but NetBeans is a pretty solid #2 at 17% ahead of JDeveloper at 12%. This would seem to support Oracle's decision to not kill NetBeans, but it is still unfortunate that it appears to be being relegated to a minor role.
And given all the noise about the Cloud, only 14% of the respondents indicate they will be deploying to the Cloud in 2010 with an astounding 67% having no plans. Now I'm sure the adoption is still way up from 2009 and 14% is still significant, but the IT industry still appears to be cautious about going hole hog into the Cloud. For those looking to use the Cloud, Amazon EC2 is still dominant at 13% but with "other" at 14% there seems to again be a missing option in the questions.
As far as operating systems for deployment go, Windows is no surprise leading at 57% but with Red Hat Linux at 35% well ahead of Solaris (18%) and other Linux variants close behind Solaris (SUSE 12%, other Linux 16%), Linux is arguably threatening Windows for the #1 spot.
Last, it is a bit of an odd question on frameworks and services as options to answer included everything from Spring to JMS to ESBs, but it is interesting to see that messaging/integration technologies like JMS and ESB at 29% and 24% are well ahead of Swing and JPA (21% and 15%) and not that far behind Spring and Hibernate (36% and 37%).
As always, data is fun to look at.
Rich correctly pokes holes in the report pointing out the strange grouping of results, the significant "other", and the egregious omission of GlassFish from the survey (quite possibly the bulk of the 18% "other"). If GlassFish was even only half of the "other" it would be 9% and equal to Jetty and way ahead of Jonas/JRun/Orion (which were grouped together for some reason) and Resin, each at only 2%, which would seem to clearly justify GlassFish being called out on its own. They do provide the raw data which is fantastic, but re-analyzing the data can't fix not asking the right questions.
But there were a few other items in the report that I found interesting.
The "most important Java IDE in 2010" is, no surprise, Eclipse, but NetBeans is a pretty solid #2 at 17% ahead of JDeveloper at 12%. This would seem to support Oracle's decision to not kill NetBeans, but it is still unfortunate that it appears to be being relegated to a minor role.
And given all the noise about the Cloud, only 14% of the respondents indicate they will be deploying to the Cloud in 2010 with an astounding 67% having no plans. Now I'm sure the adoption is still way up from 2009 and 14% is still significant, but the IT industry still appears to be cautious about going hole hog into the Cloud. For those looking to use the Cloud, Amazon EC2 is still dominant at 13% but with "other" at 14% there seems to again be a missing option in the questions.
As far as operating systems for deployment go, Windows is no surprise leading at 57% but with Red Hat Linux at 35% well ahead of Solaris (18%) and other Linux variants close behind Solaris (SUSE 12%, other Linux 16%), Linux is arguably threatening Windows for the #1 spot.
Last, it is a bit of an odd question on frameworks and services as options to answer included everything from Spring to JMS to ESBs, but it is interesting to see that messaging/integration technologies like JMS and ESB at 29% and 24% are well ahead of Swing and JPA (21% and 15%) and not that far behind Spring and Hibernate (36% and 37%).
As always, data is fun to look at.
Thursday, April 8, 2010
links for 2010-04-08: C overtakes Java; Amazon SNS; Statistics and Data; Oracle and MySQL; iPhone OS 4
- TIOBE Programming Community Index for April 2010 - C is #1 again overtaking Java! Due in part to other languages supported on JVM but interesting nonetheless.
- Amazon Simple Notification Service (SNS) - Notifications/events in the cloud. Good stuff.
- Why I'm Taking Statistics - It's all about the data!
- Oracle to Outline Strategy for MySQL - State of the Dolphin, Tuesday next week.
- Apple's iPhone OS event: What to expect -
Thursday, April 1, 2010
links for 2010-04-01: NoSQL = Manual vs Auto; Automated Journalism; Scatterplots with R; Will the cloud rain cash?; Bing killing OpenOffice?; Logarithms
- The NoSQL Debate: Automatic vs. Manual Transmission - A good metaphor. Perhaps NoSQL should really be abbreviating "Not Only SQL" and not "No SQL"?
- Automated Journalism: In the US, algorithms are already reporting the news - Reposted from a comment to yesterday's links, very interesting. "do algorithms steal the work of journalists - or help them to cope with information overload?"
- "Different" by Youngme Moon - Great way to promote a book, and piqued my interest in it.
- How to: make a scatterplot with a smooth fitted line - I did not know about R (probably should have), but appears to be a cool tool for working with data. Love it. And provides a source for unemployment data should you want it.
- When will cloud computing start raining cash? - "... there's a tremendous amount of trial and evaluation happening right now, which should translate into paid engagements in the very near future."
- Lawson ERP on Amazon Web Services - An example of the move to the cloud.
- Bing trying to kill OpenOffice? - An update at the end of the story says it is a technical issue, but this makes one think about the control we give to the search engine we use.
- Apple: Simplicity taken too far? - "I've heard a growing chorus of open-source voices shifting from Microsoft as (open-source) public enemy No. 1 to Apple."
- Opinionator - Power Tools - If you never understood logarithms in school, this is a good read.
Saturday, March 27, 2010
links for 2010-03-27: Mickos to Eucalyptus; RedHat does right by JBoss; Mobile Metrics Report
- Mickos: What's bigger than open source? - The answer, for Marten at least, is in the cloud.
- Red Hat does right by JBoss - Future of middleware webinar 4/13.
- February 2010 Mobile Metrics Report - Interesting data
Thursday, March 18, 2010
links for 2010-03-18: Elastic Caching Platforms; Whole Web; Google Calendar
- Elastic Caching Platforms Balance Performance, Scalability, And Fault Tolerance - A nice write-up on caching platforms and their benefits.
- Tim O'Reilly: 'Whole Web' is the OS of the future - Open source has allowed the Google's of the world to get to where they are and control the data. And as I wrote previously, it is all about the data and the analytics you can perform on it.
- Google targets admins with meeting rescheduler for calendar - Sounds like a useful feature.
Friday, March 12, 2010
Data is a Wonderful Thing
The world we live in is generating increasing amounts of data each and every day. And this is great as when you have the data, you can analyze and graph it in new and interesting ways. From sports to weather to financials to politics to demographics to who knows what, being able to analyze data, look at trends, and visualize it through graphs, charts, maps, etc. brings tremendous power and insight.
Some examples of interesting data or analysis thereof I've come across in just the past week or so:
Some examples of interesting data or analysis thereof I've come across in just the past week or so:
- Who Drives Better, Men or Women? - A good example of how you need to look at data in the right context in order to arrive at the right conclusion.
- What Sports Can Teach Us About Analytics: The MIT Sloan Conference - Sports, in particular baseball, has a vast amount of great data and like me, Stephen can't get enough of it. But like he observes, the conference being about sports is somewhat incidental and the lessons learned can be applied to traditional business.
- My Basketball Computer Rankings - I have traditionally focused on football, but the past few years I've taken a closer look at who "should" make the 65 team NCAA basketball tournament. It never ceases to amaze me how accurate a computer just looking at scores can be in predicting or projecting results.
- Statistics for a changing world: Google Public Data Explorer in Labs - A tremendous resource for accessing and looking at vast amounts of data.
- Strange Maps - A bunch of interesting ones. Did you know that the farthest you can get from a McDonalds in the lower 48 is 145 miles?
Stay tuned, I'll continue to share interesting data and applications of it I come across.
Wednesday, March 10, 2010
links for 2010-03-10: Google Public Data Explorer; iPhone Dev Agreement; Distributed companies
- Data visualizations for a changing world - The more data we have (and the rate of growth of it is exploding), the more tools like this are very useful.
- iPhone developers: What they give up to get into Apple's app store - Confirms much of what had been rumored. Not developer friendly at all.
- 5 reasons why your company should be distributed - Nice highlighting up the benefits, but no mention of the downsides.
Subscribe to:
Posts (Atom)